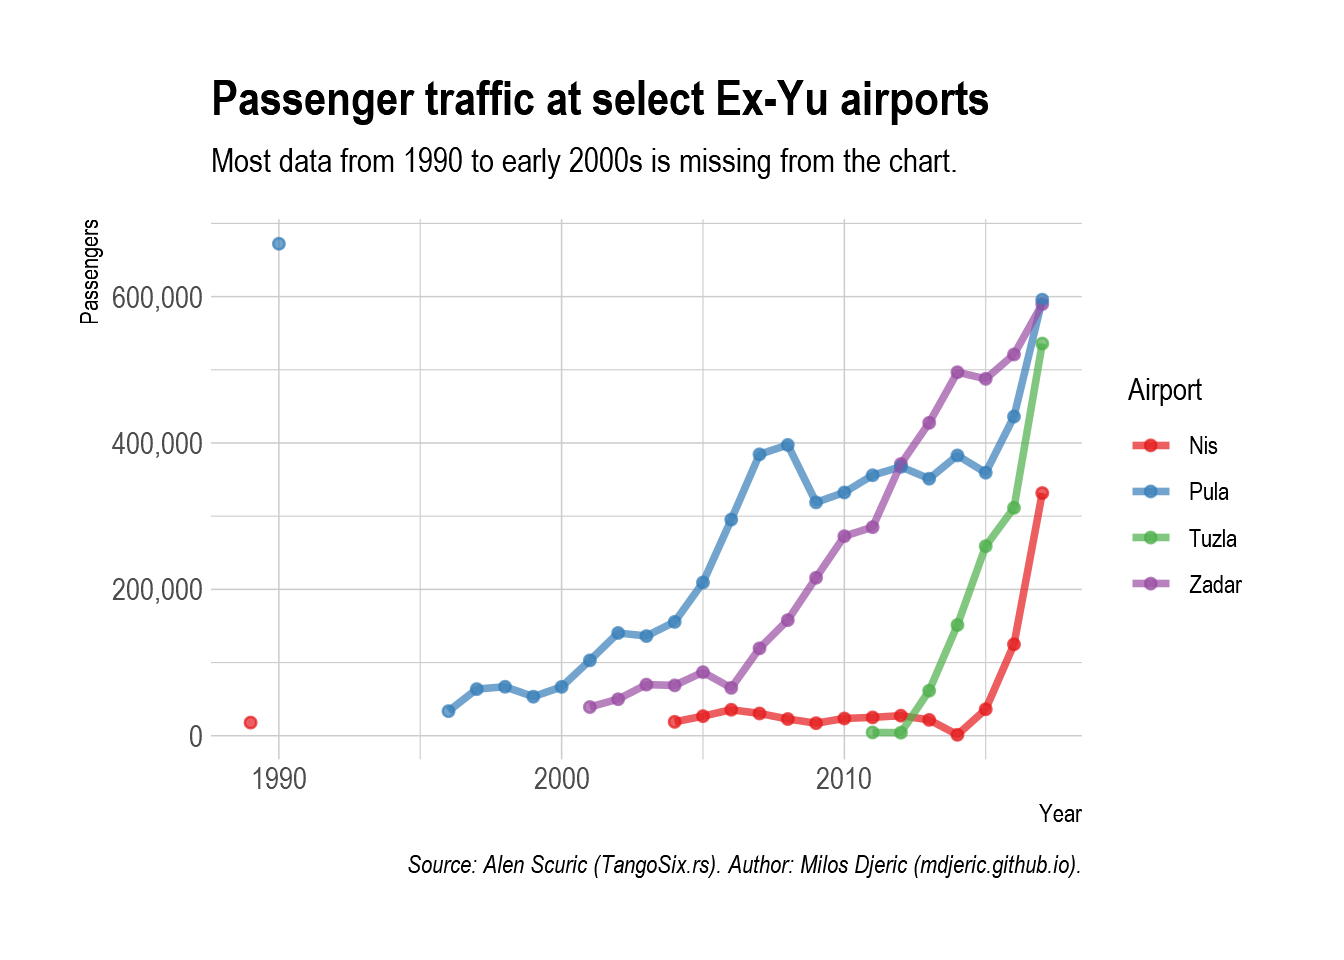
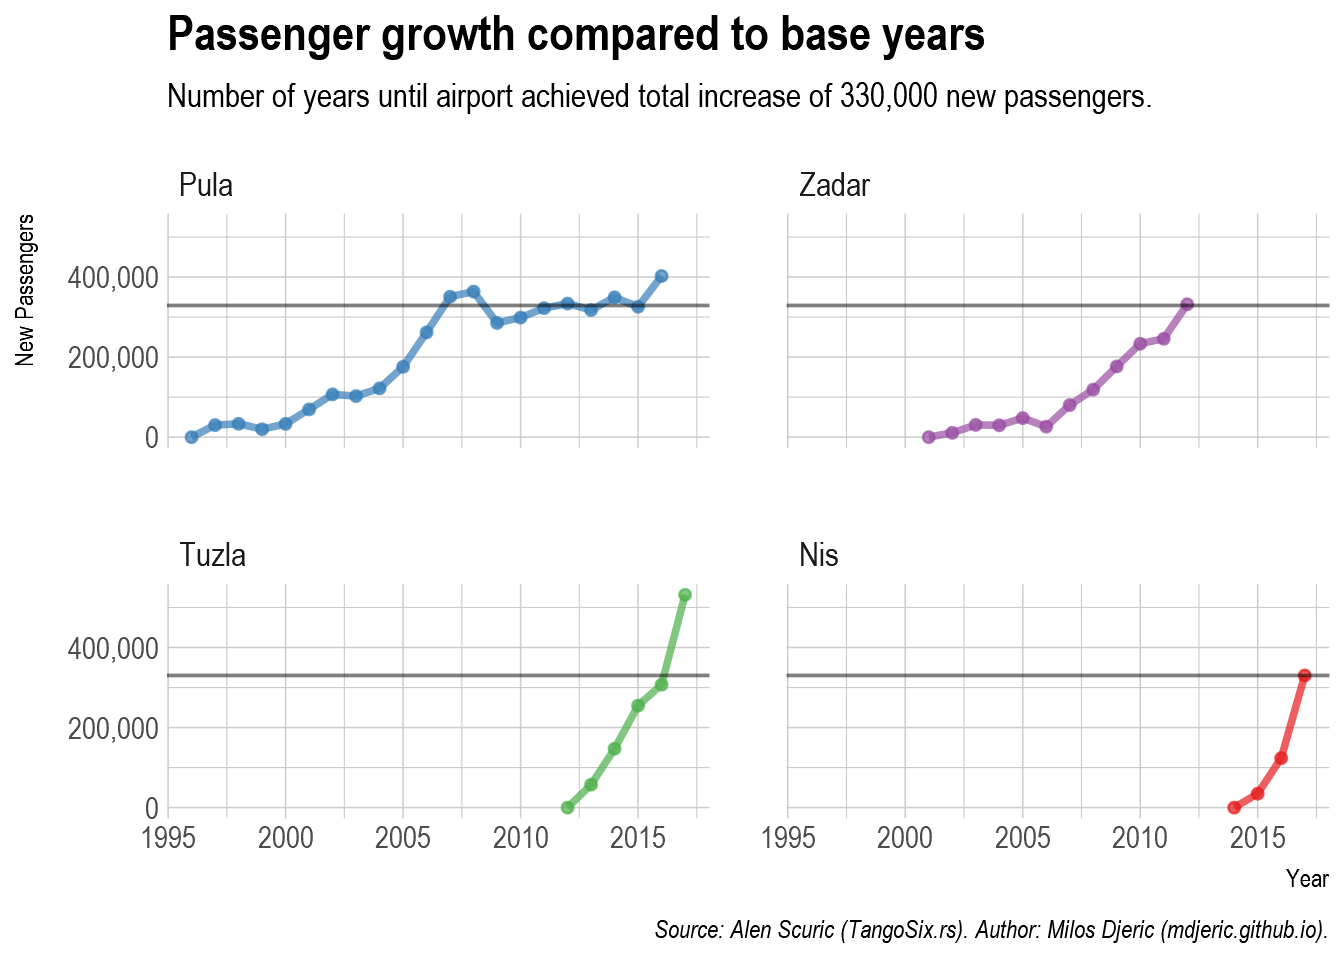
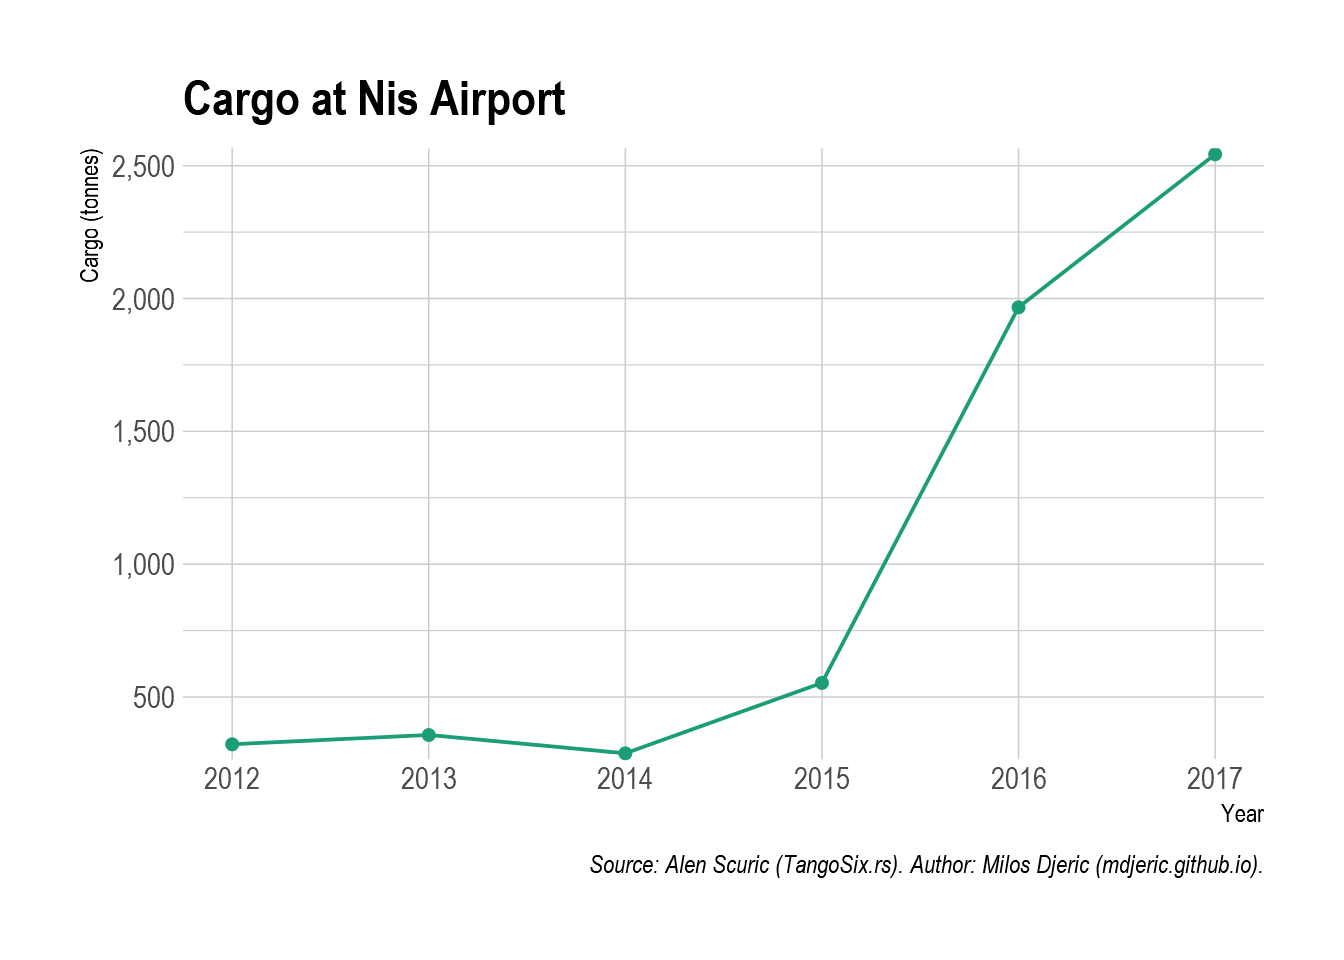
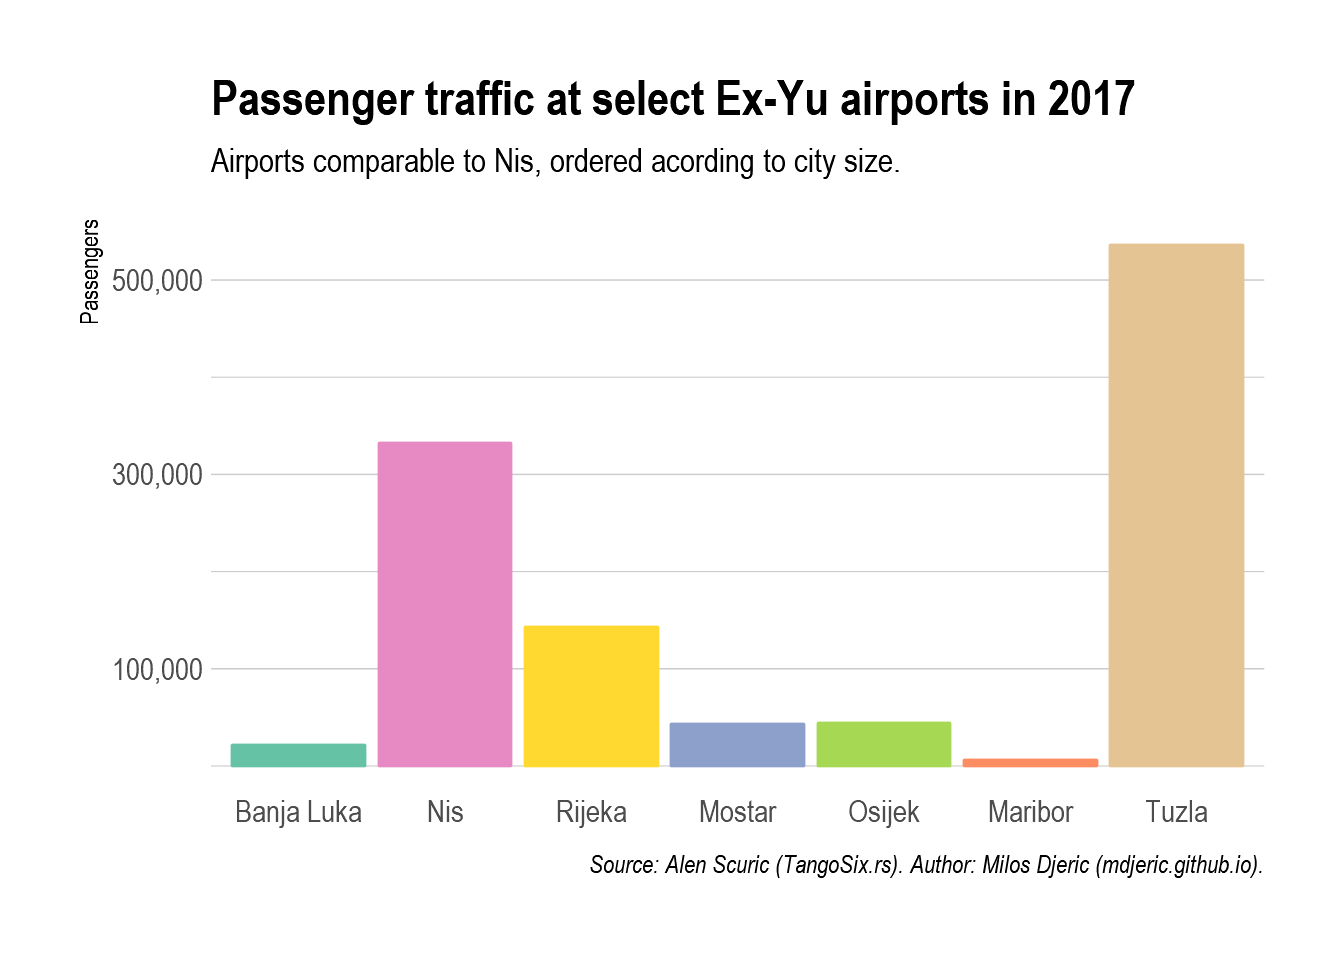
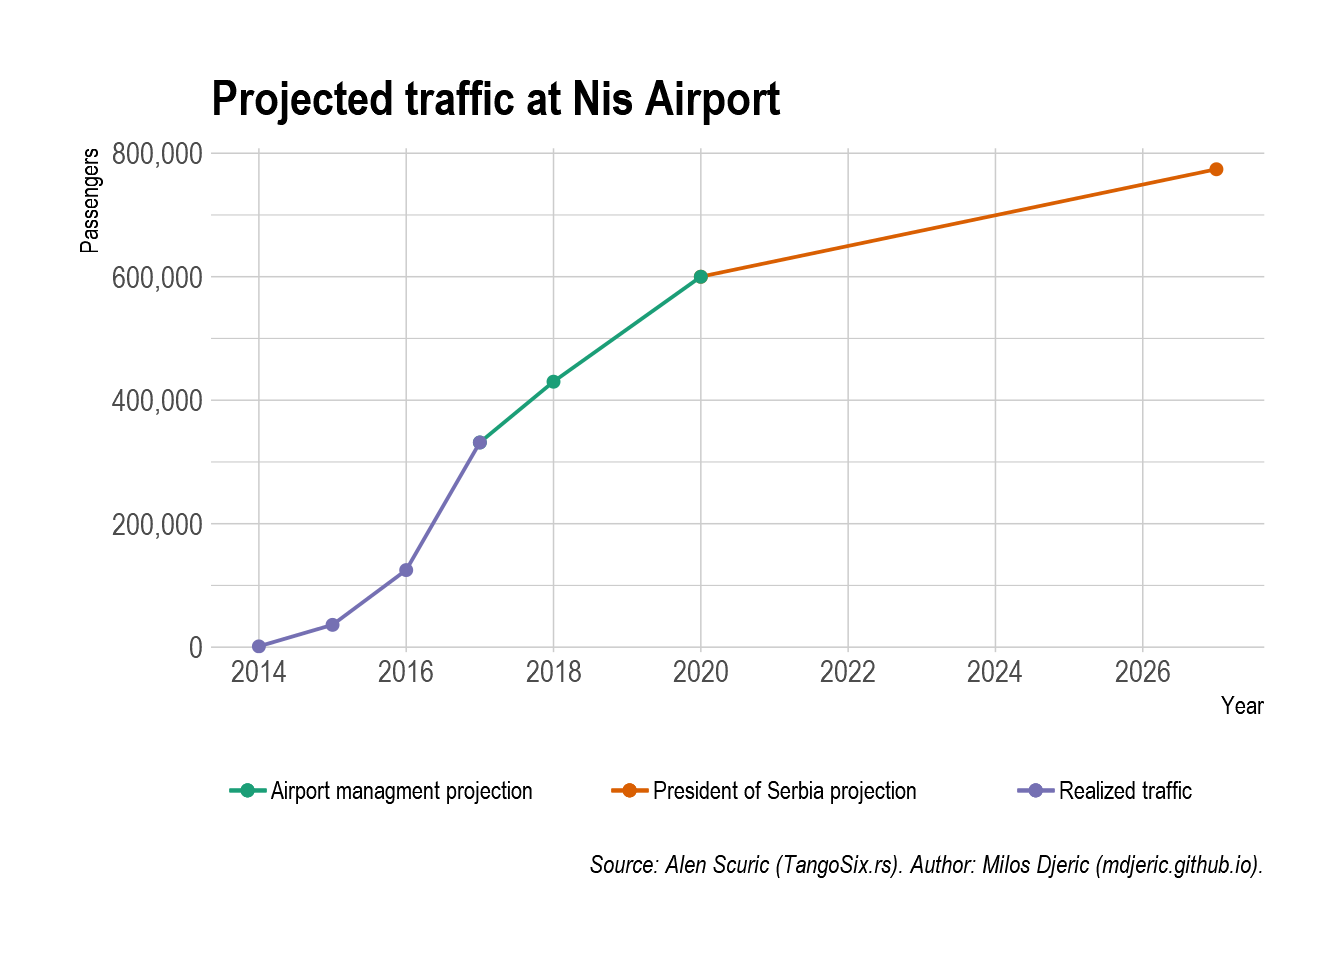
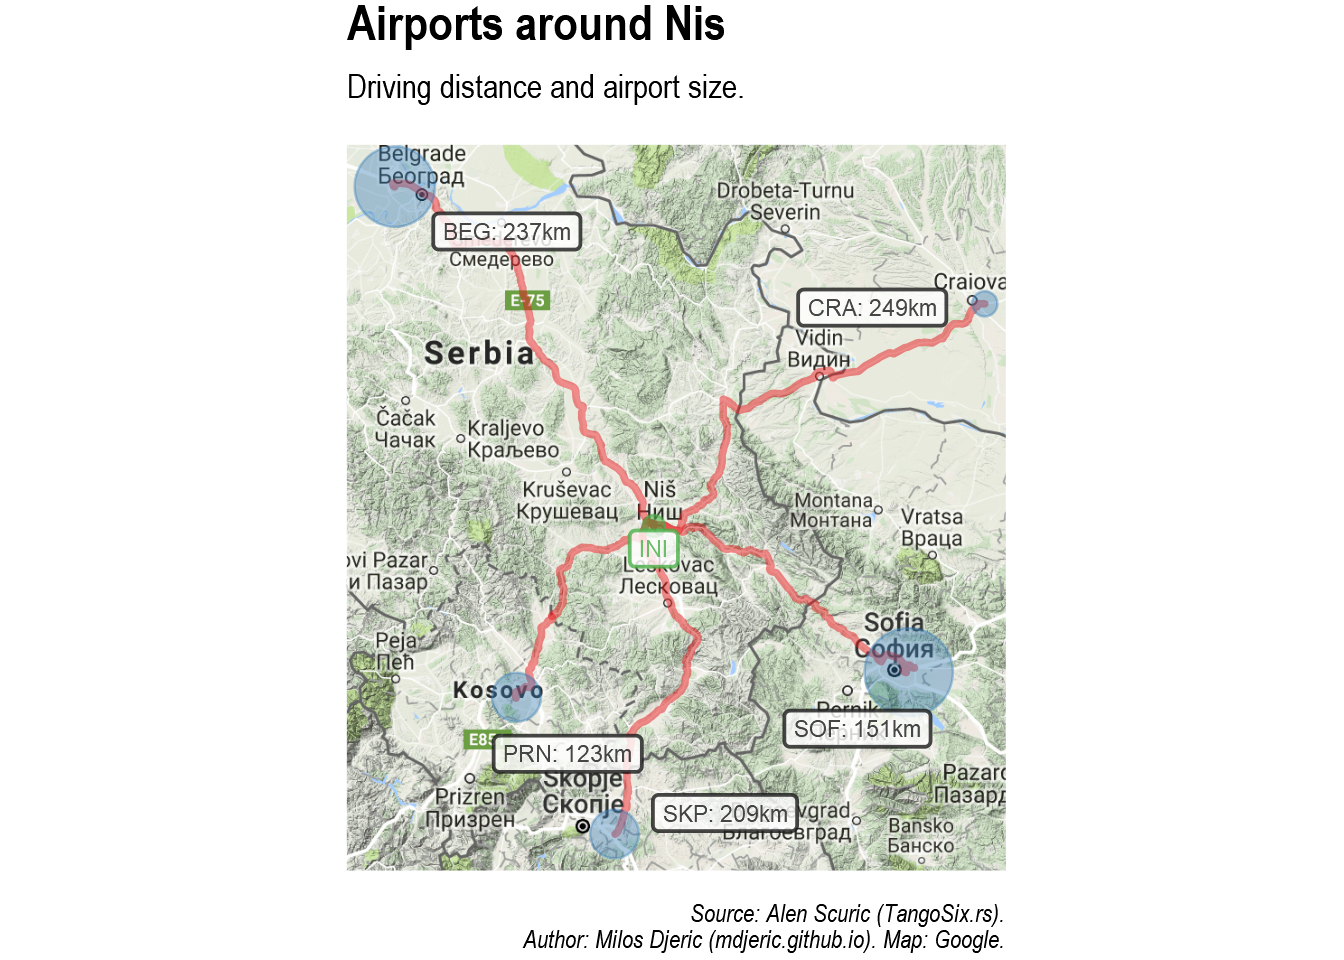
Tables are improved visualisations from the analytic article “Who and why has a problem with airport in Nis”, by Alen Scuric (in Serbo-Croatian, Kome to i zasto smeta aerodrom u Nisu?).

Animation of rising traffic at Nis, Pula, Tuzla, and Zadar airports.

Static plots

Plot with traffic at Pula rizing from 2000, Zadar rising from 2005, Tuzla rizing from 2012, and all reaching close to 600,000 passengers, along wtih steepest slope of rise Nis airport from 2014

Four faceted airports showing time needed to attract 330,000 new passengers: Pula 20 years, Zadar 10 years, Tuzla 5 years, Nis 3 years

Chart with rise of cargo at Nis Airport, from 0 tonnes in 2014 to 2,500 in 2017 Barchart with passenger traffic in 2017 compared at airports for cities with similar size in the region, Nis stands out with more than 300,000 and Tuzla with more than 500,000 Chart with projected growth at Nis airport. Airport managment prediction: 2018 410000, 2020 600000; President of Serbia projection 2027 800000.

Map

Map with distance and path to four airporst closest to Nis: PRN 123km, SKP 209km, SOF 151km, CRA 249km, BEG 237km

Interactive Plots

Using HTML widgets and plotly.

Packages used

Following packages were used to create plots: tidyverse, plotly, hrbrthemes, scales, gganimate, ggmap, googleway, ggrepel, RColorBrewer.